Home2026-08-06T01:29:11+00:00

The Family Well-being Indicators

Evidence for a Brighter Future

Prevent Child Abuse America’s Family Well-being Indicators assembles key datasets that help communities identify opportunities to build healthy ecosystems of support.

section1-image

We all play a role in family success. And with the right tools, we can engineer healthy prevention ecosystems.

We amplify impact when we move forward together: across states, systems, and communities.

section2-image
section2-image
The Indicators

Developed in partnership with community leaders, public health professionals, private philanthropy, and other national partners, the Family Well-being Indicators is a tool to identify family strengthening opportunities and measure the impact of primary prevention strategies, programs, and investments with empirical data.

What We are Learning

The Family Well-being Indicators compiles child maltreatment data, such as investigations, victimizations, and fatalities, as well as children flourishing indicators, reductions in Adverse Childhood Experiences (ACEs), and more.

0%

Children with no ACEs

0%

Children aged 6 months to 5 years are flourishing

0%

Children aged 6 years to 17 years are flourishing

The Questions We’re Asking the Data
What’s Happening in my State or Region?

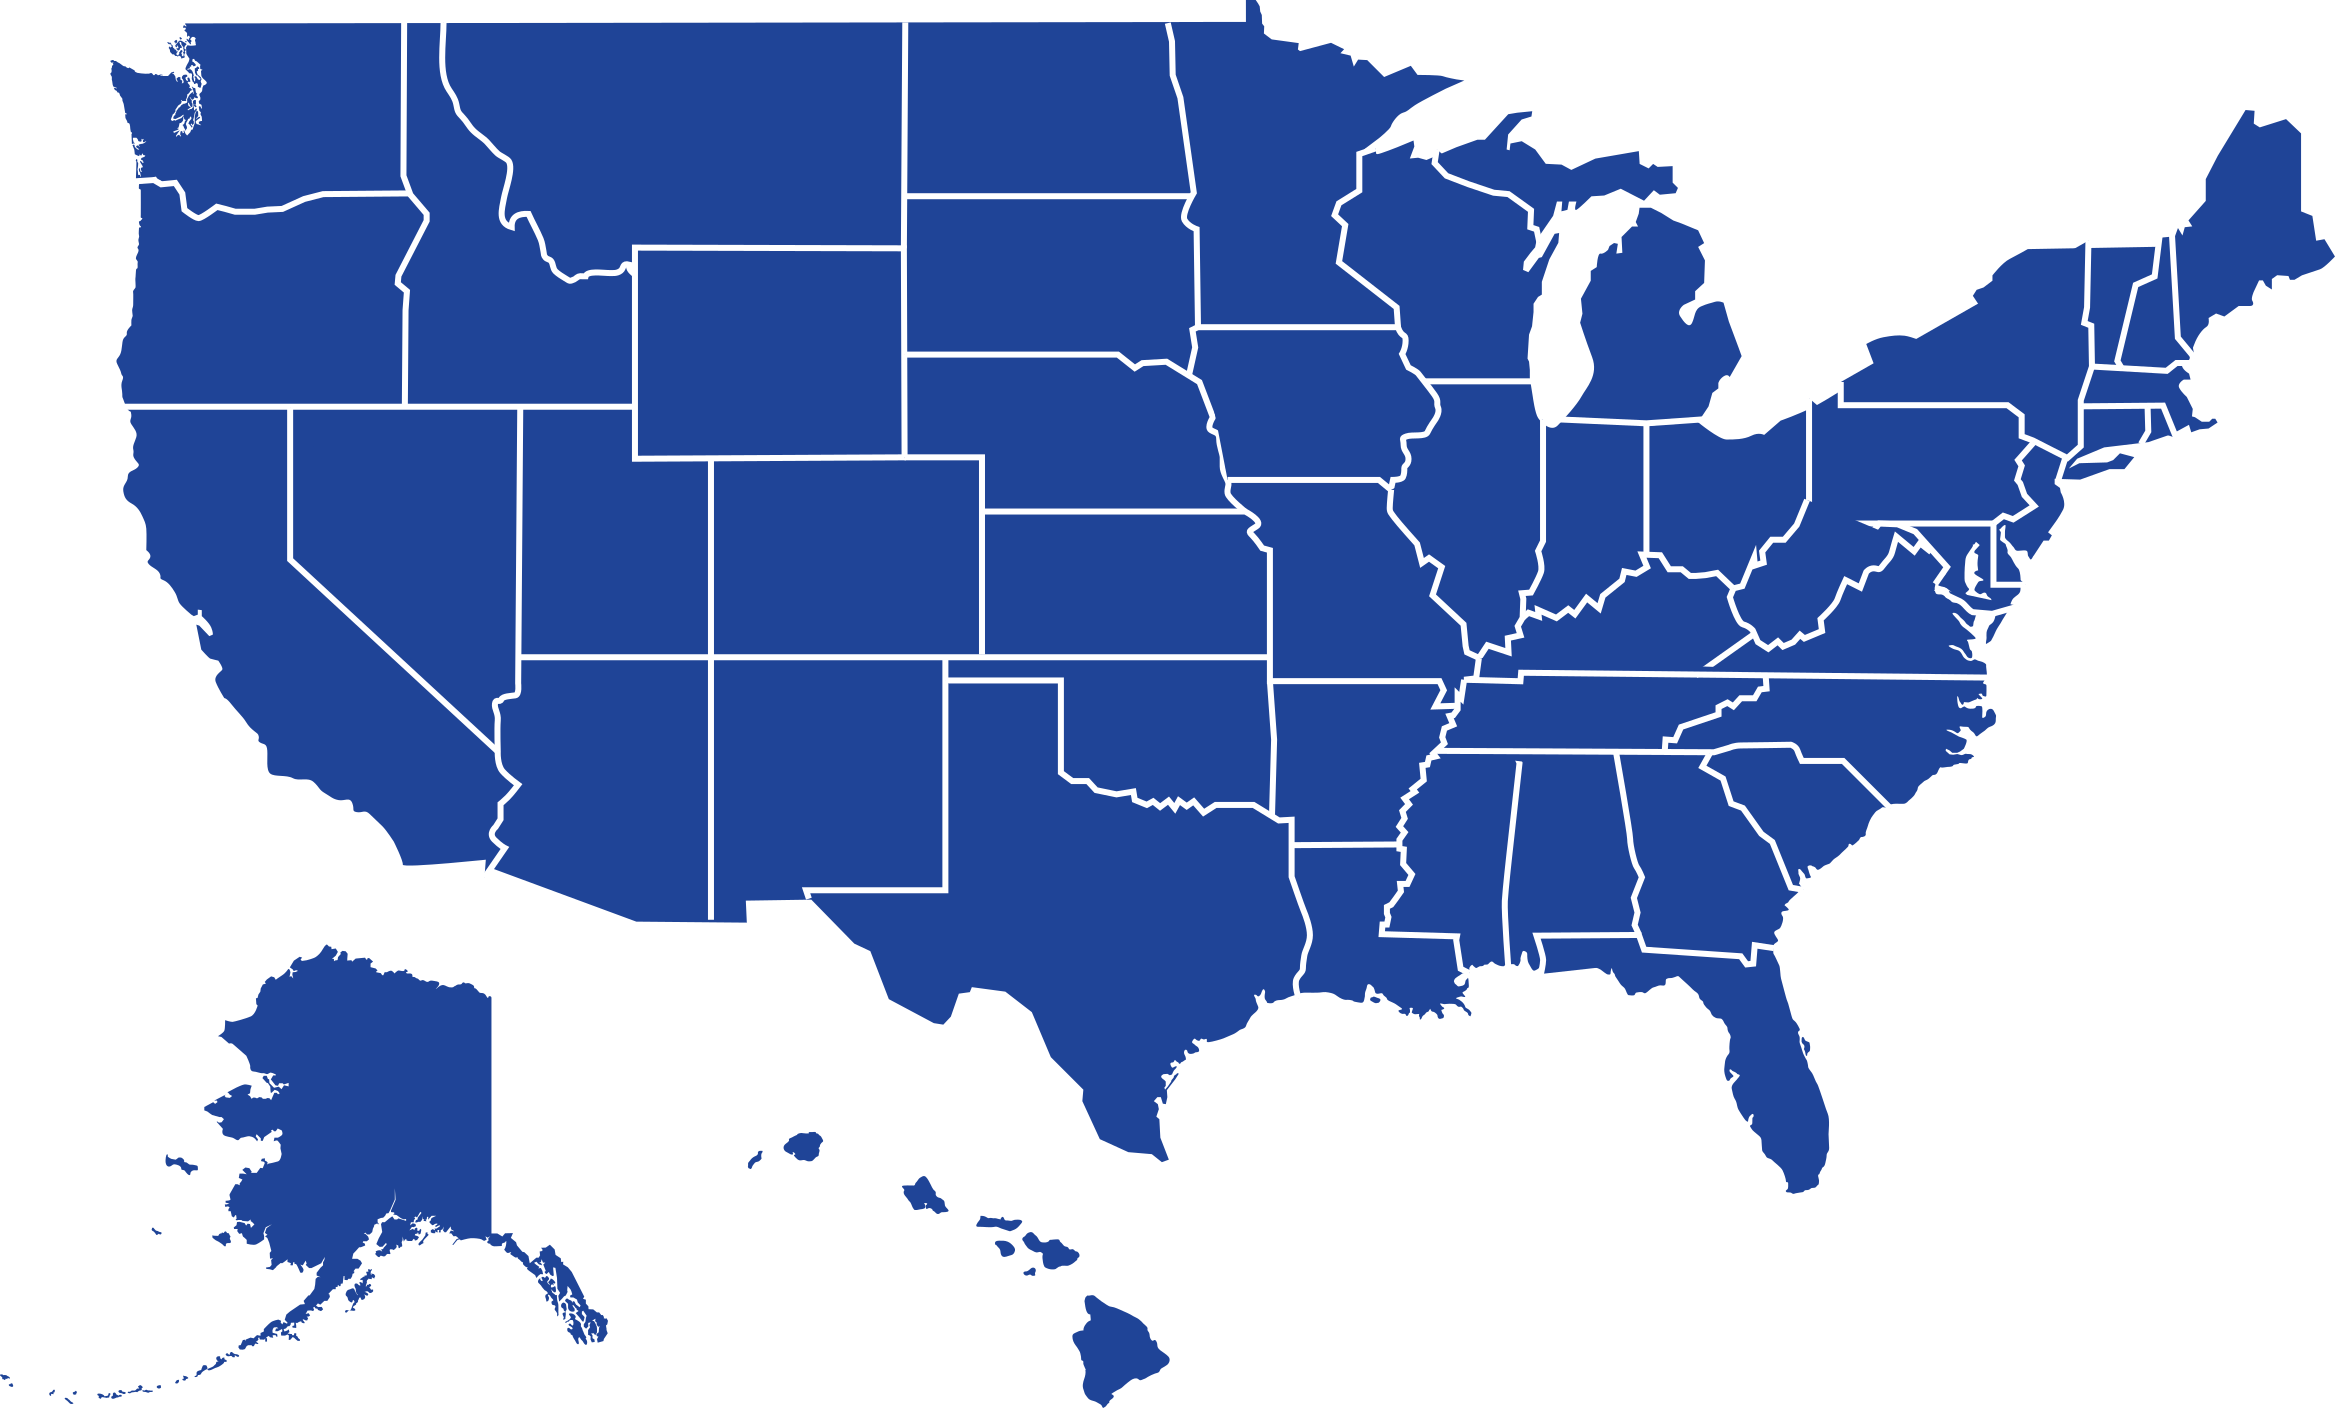
View your state’s family well-being summary by hovering over the interactive map feature or click the buttons below for state profiles, as well as compare trends by region.

We Value Your Feedback

Your feedback helps us improve. Please take a moment to complete this short survey so we can better understand your needs and create a more seamless experience. Thank you for helping us make the site better for everyone.

You can launch this survey at any time from the "Feedback" link at the top of the page.

We Value Your Feedback

Your feedback helps us improve. Please take a moment to complete this short survey so we can better understand your needs and create a more seamless experience. Thank you for helping us make the site better for everyone.

You can launch this survey at any time from the "Feedback" link at the top of the page.

We Value Your Feedback

Your feedback helps us improve. Please take a moment to complete this short survey so we can better understand your needs and create a more seamless experience. Thank you for helping us make the site better for everyone.

You can launch this survey at any time from the "Feedback" link at the top of the page.

We Value Your Feedback

Your feedback helps us improve. Please take a moment to complete this short survey so we can better understand your needs and create a more seamless experience. Thank you for helping us make the site better for everyone.

You can launch this survey at any time from the "Feedback" link at the top of the page.

How You Can Use This Data

What the Community is Saying

“With the new Blueprint and the Family Well-being Data Dashboard, our chapter can make real-time decisions on what matters most for prevention. This tool not only guides strategy—it elevates the voices and lived experiences of families in each state, making well-being visible and measurable as a data point. We know that every data point represents real people, real families, and real stories. This tool provides an accurate snapshot of community needs and a powerful compass for driving solutions that truly strengthen family well-being.”

Mia Crockett, CEO Families Forward Virginia/PCA Virginia

“We’re excited to have a tool that enhances our ability to compare North Dakota’s data with other rural or neighboring states. While this data exists across various platforms, having it in one place, with easy-to-use filter, saves us valuable time and effort. This strengthens our ability to tell the story of our work at Healthy Families ND, whether we’re writing grants, meeting with donors, or advocating with state leaders about the importance of prevention.”

Missi Baranko, USpireND Executive Director

“There is a significant need for a data approach that centers wellbeing vs relying on metrics associated with crisis or systems interaction. It’s often challenging to tell the story of prevention, because the current metrics used ask us to tell the story of what didn’t happen (abuse, adversity, etc). By aligning our data approach with the Blueprint from PCA America, we have an opportunity to reimagine the metrics we use to tell the story of wellbeing.”

Nicole Cunningham, Executive Director, PCA Oregon

“The Blueprint for Family Well-being succinctly organizes the interconnected players, relationships, and actions necessary for making our country a place that raises thriving children. This data dashboard helps leaders like you chart a path towards that vision within your own state’s landscape.”

Claire Louge, Executive Director, Prevent Child Abuse Arizona

Frequently Asked Questions

What if I can’t find the data I’m looking for or need help interpreting it?2026-05-18T17:24:26+00:00

If you can’t find the data you’re looking for or need help interpreting it, please use the Contact Us form to send our Research Team a data inquiry. PCA America’s trained professionals can help you locate, understand, or in certain circumstances, participate in collecting data that activates the Evidence for a Brighter Future.

How can I identify state-level areas of opportunity?2026-08-03T03:27:05+00:00

While conditions for families vary location to location, The Family Well-being Indicators Heat Maps allow users to quickly identify state-level areas of opportunity for family strengthening programs and strategies that address systemic issues and barriers.

How can I use this data to improve conditions for children and families?2026-05-18T17:13:05+00:00

Because our work centers families and is grounded in science, PCA America created The Blueprint for Family Well-being as a roadmap for the primary prevention field to promote a unified movement that ensures all children and families are living a purposeful and happy life with hope for the future.

The Family Well-being Indicators is a tool guiding public health professionals, community organizers, policy makers, and more, in understanding and improving current conditions for children and families. The data collected here can be used to support:

  • Program or service evaluation
  • Advancing policy and practices
  • Communications and narrative change efforts
  • Grant writing and development campaigns
What is the difference between child maltreatment investigations and child victims?2026-08-03T03:50:06+00:00

A child maltreatment investigation is a screened-in, investigated allegation of abuse or neglect received by a Child Protective Service (CPS) agency. Additionally, “Investigation counts” are the number of unique children involved in the child maltreatment investigation. “Investigation rate” is the number of children investigated per 1000 children in the population.

Child victims of maltreatment are also screened-in investigations of abuse or neglect received by a Child Protective Service (CPS) agency that were then found to be substantiated or indicated. “Victim counts” are the number of unique child victims of maltreatment. “Victim rate” is the number of child victims per 1000 children in the population.

See the “Dashboard Data Discussion” for additional details regarding the meaning of investigations and victims. Should you need help interpreting the data, send us an email with the Contact Us form.

Why is there no data on Positive Childhood Experiences (PCEs)?2026-05-18T17:26:16+00:00

Positive Childhood Experiences (PCEs) describe the events, relationships, and environments that promote healthy child development and act as a buffer against negative impacts of Adverse Childhood Experiences (ACEs). However, because nationwide data is unavailable, it’s not included.

What are Adverse Childhood Experiences (ACEs)?2026-08-03T07:42:04+00:00

Adverse Childhood Experiences (ACEs) are a collection of potentially distressing events such as violence, abuse, or neglect that occur in childhood (ages 0-17).

Childhood exposure to prolonged traumatic events may result in a toxic stress response, disrupting brain development and increasing the risk of poor physical health, coping skills, or other long-term cognitive impairments.

While researchers and practitioners across many disciplines (e.g., developmental psychology, pediatrics, social work) had general knowledge of the connection between trauma and healthy development, the 1998 landmark ACEs Study by the Centers for Disease Control and Prevention (CDC) and Kaiser Permanente deepened this understanding.

To view your state’s Adverse Childhood Experiences (ACEs) data click HERE.

Are children and families thriving in my state or region?2026-08-03T04:52:21+00:00

While the science supporting child and family strengthening strategies and approaches is robust, some indicators estimate the number of children who are thriving, those who can improve their thriving, and those who are at risk of not thriving.

To see how younger and older children are doing, by State, Sex, and Race, click HERE

How often will you refresh the data?2026-05-18T17:26:37+00:00

PCA America is committed to refreshing the data annually to ensure accuracy, consistency, and alignment with finalized reporting cycles. Because we are using existing national-level data sources, we are bound to their reporting timelines. Each update will incorporate the most recently available data set, which may result in slight delays between real-time events and when they are reflected in the dashboard.  

Why don’t you disaggregate all the data?2026-05-18T17:23:40+00:00

Disaggregated data is important to understand as it helps us identify the differences in experiences and outcomes across communities, allowing for more informed and equitable decision-making. However, disaggregated data is not always available due to limitations in data collection, reporting practices, or privacy considerations, particularly when sample sizes are small.

We are committed to expanding the availability of disaggregated data whenever possible and continuing to tell a more complete and nuanced story. We welcome feedback or insights on what would be most helpful to include in future updates

How do I learn more about the datasets?2026-08-03T04:16:11+00:00

All relevant information, resources and links can be found in the Data Dashboard Documentation.

How are you defining maltreatment, victims, etc.?2026-08-03T04:19:55+00:00

Data elements and definitions can be found in the Data Dashboard Documentation, specifically section IV.

Go to Top